Figure: Generated Depth Map as (Left) Minimum Reciprocal Distance between correspondences is varied between 0-10, (Center) as Maximum Correlation Difference is varied from 0-55, and (Right) as Minimum Template STD is varied from 0-25.
GUI Details
- Load Images
- Get Good Features
- Match Points
- Generate Depth Map
Implemented Algorithms
- Point Matching
- Depth Map Generation
Integrated Technologies
- Open Computer Vision Library (OpenCV)
- Java Native Interface (JNI)
- Java Web Start
- Java Advanced Imaging (JAI)
- Jakarta Mathematics Library
The goal of this project is to investigate and experiment with computer vision techniques for determining relative depth of points in a space, given images taken by a robot in motion.
This project is written almost entirely in the Java language, with the help of several integrated technologies. We used the Personal Exploration Rover (PER) to take pictures while in motion, and implemented stereo vision algorithms to create depth maps of these images.
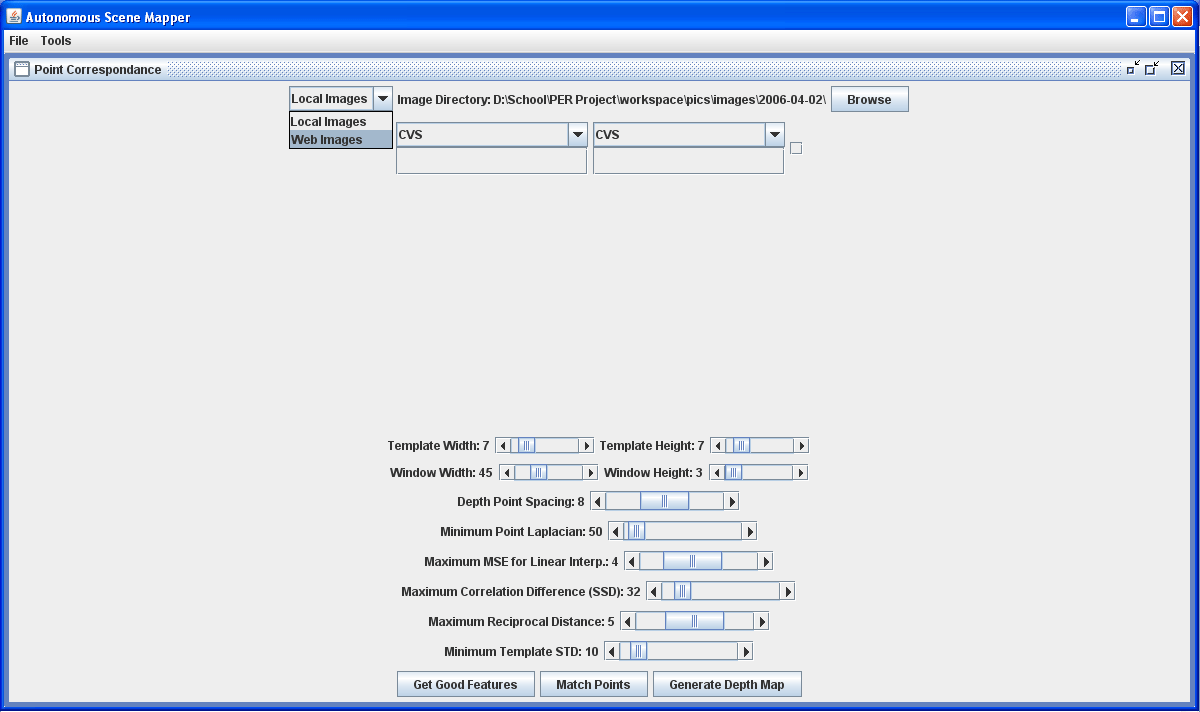
The end result is an application that takes two images taken with a horizontal disparity, and uses computer vision algorithms to match corresponding points in the two images, and to create a depth map of the space the images represent. This application is available online here. The GUI of the application allows users to load local or web images, and to change and experiment with many of the parameters of the computer vision algorithms that the application uses.
We introduce our project, by first providing a quick walkthrough example
of how to use the GUI and underlying algorithms with real images. Both are explained in more detail later. The GUI for this project allows users to load two images of a scene taken with a
horizontal disparity, and uses computer vision algorithms to match corresponding points in
the images and to create a depth map of the scene the images represent. The GUI also allows users to experiment with many of the parameters of the algorithms that the application uses. Here is an example how the
application should look once two images are loaded: The Get Good Features
button uses the GoodFeaturesToTrack
function in the OpenCV library to determine strong corners in the two loaded
images and display them on the images. These points can be used with high
confidence for matching points between images. The number of points displayed
can give an idea of how accurate of a depth map it is possible to create for the
given scene.
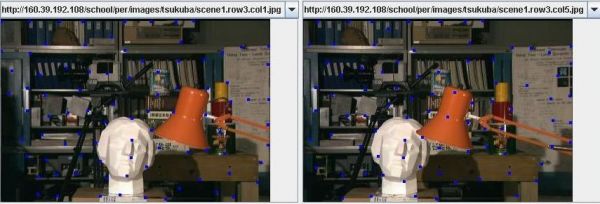
Here is an example of how
loaded images appear after the Get Good Features button is pressed. The
results of the GoodFeaturesToTrack
function
are overlaid on the images as blue points.
The Match Points
button uses a scanline pattern matcher to find and display corresponding
points in the two loaded images. The pattern matcher matches points from the
left image to corresponding points in the right image. Please disregard the Correlation
Method parameter. The following parameters
control the size of the point template from the left image and the search window
in the right image: Template Width &
Height Size of the template in
left image used for point matching. Window Width &
Height Size of window in right
image in which to match template. The images are assumed to have a horizontal
disparity, so a wide and short window is appropriate. However, the window can be
heightened if there is a vertical disparity between the images as well. The following parameters
control which points from the left image are matched to corresponding points in
the right image: Depth Point Spacing The
left image is divided into n x n squares of pixels, where n is the value of the Depth
Point Spacing parameter. The pixel with the highest Laplacian value (the
resulting value when the Laplacian operator is applied to the pixel) in each
square is retained for point matching. All other points are not matched and are
not used for depth map generation. A Depth Point Spacing value of 0
results in all points in the image being retained for matching. Minimum Point Laplacian
The Laplacian value of a point is calculated by applying a <size>
Laplacian mask on a point in the left image. Points with high Laplacian values are
favored because they have high intensity contrasts with points around them, and
are more likely to produce an accurate match in the offset image. Points with a
Laplacian value less than Minimum Point Laplacian are neither displayed
nor used for depth map generation. Maximum MSE for Linear
Interpolation - Maximum Mean-Square
Error of the linear model. At one point in the project, we experimented with
applying a linear regression to nearby points, and if the depth values for the
points adhered well to a linear regression model, than all of the depth values
in between those point would be interpolated using the linear model. This
was useful for matching points in featureless areas, such as walls and floors. Maximum Mean-Square Error
represents the maximum error
between the actual depth values and the linear model computed to represent them
that could exist if linear interpolation of depth values was to occur. Maximum Correlation
Difference (SSD) Correlation
between two matched points is measured in terms of the sum of squared
differences between each pixel in the template in the left image and the corresponding
pixel in the matched template in the right image. Points with a correlation difference
greater than Maximum Correlation Difference are neither displayed nor
used for depth map generation. Maximum Reciprocal Distance To find the reciprocal distance of a point in the left image, the point is matched in the right image, and that corresponding point is again matched in the left image. The pixel distance between the original left image point and the matched left image point is the reciprocal distance of the original point. Points with a reciprocal distance greater than the value of Maximum Reciprocal Distance are neither displayed nor used for depth map generation.
Minimum Template STD - The
minimum required standard deviation of the illumination within the template. The
idea behind this value is to filter out matches that were based on templates
with very small variations within the template. For example a solid template
extracted off a highlight on a wall would have a STD of 0, since all values were
exactly identical. In such a case, a match is nearly meaningless, and in
general, as the STD increases, the probability of a better match improves as
there is more uniqueness within the template with which to match to the
corresponding image. Points with a pixel standard deviation less than Minimum
Template STD within the pixel template are neither displayed nor used for
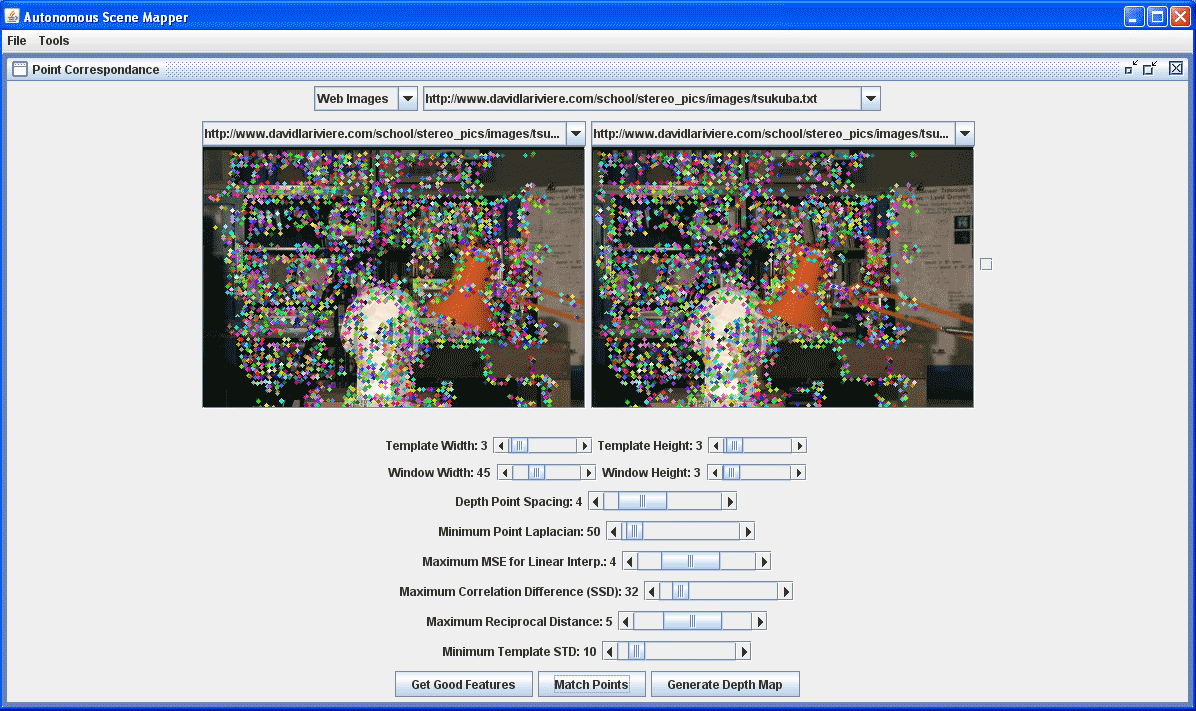
depth map generation. The matched points are
displayed in the two images. Corresponding points are the same color in the two
images. Here is an example of how
loaded images appear after the parameters are set at their defaults and the Match
Points button is pressed: Statistics on each matched
point can be viewed by opening the console
window (Tools à
Console) and clicking on a point. The following statistics on that point are
then displayed
in the console window: Location - location
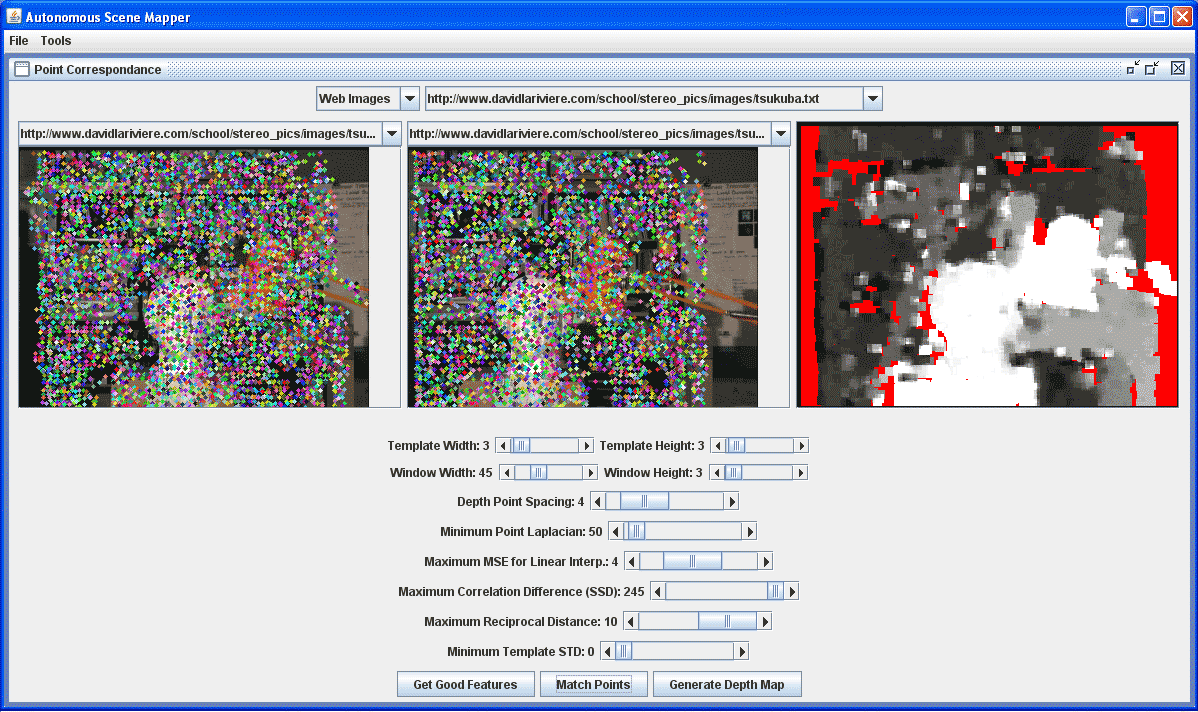
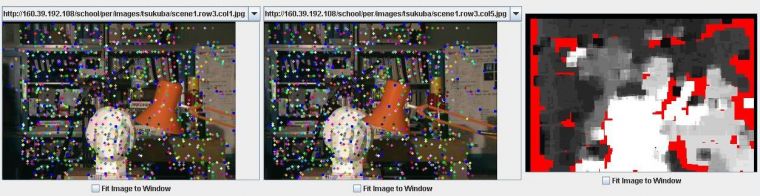
of point in left image and in right image. Generate Depth Map The brighter a point is in
the depth map, the closer that point is to the camera, relative to all other
points in the image. If a point is red, then there is not enough information to
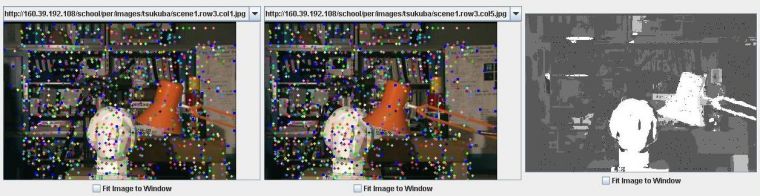
determine the relative depth of that point. Here is an example of how
loaded images appear after the parameters are set at their defaults and the
Spatially Aggregated depth map is displayed: Changes to the Maximum Correlation
Difference (SSD),
Maximum Reciprocal Distance and Minimum Template STD parameters are dynamically reflected in the displayed matched points and in the depth map. Here is an example of how
loaded images appear after the parameters are set at their defaults and the Generate
Depth Map button is pressed: Scanline Pattern Matcher The ScanLine Pattern
Matcher matches corresponding points in two images of a scene taken with a
horizontal disparity. Parameters of the pattern matcher can be adjusted by the
user in the PICS application GUI. The pattern matcher first
determines which points in the left image will be matched to points in the right
image. It attempts to choose points that will produce confident matches. It
first calls the OpenCV function GoodFeaturesToTrack,
which finds strong corners in an image, which can then be used with high
confidence for matching points between images. This is the description of GoodFeaturesToTrack
from OpenCV
documentation:
The function cvGoodFeaturesToTrack
finds corners with big eigenvalues in the image. The function first calculates
the minimal eigenvalue for every source image pixel using cvCornerMinEigenVal
function and stores them in The points returned by cvGoodFeaturesToTrack
are retained for point matching. The
left image is then divided into n x n squares of pixels, where n is the value of the
Depth
Point Spacing parameter. The pixel with the highest Laplacian value (the
resulting value when the Laplacian operator is applied to the pixel) in each
square is retained for point matching. All other points are discarded. The retained points from the left image are
then matched to points in the right image. To match a left image point (x, y), a
template of pixels surrounding the left image point is taken, and a search
window surrounding the point (x,y) in the right image is searched for a block of
pixels matching the left image template. The correlation between the left image
template and a block of pixels in the right image is measured in terms of the sum of squared
differences between each pixel in the template in the left image and the corresponding
pixel in the matched template in the right image. The right image point within
the search window whose template produces the highest correlation is
chosen as the match for the left image point. The matched points are then filtered to
retain only the most confident matches. The filtering parameters can be
controlled by the user. A description of these parameters can be found in the GUI
How-To. The points that remain following the
filtering are retained and used for depth map generation. The purpose of the depth
map generator is to color every pixel with an illumination value proportional to
the believed depth of the point, relative to all other points in the image. The
closer a point is believed to be, the brighter its value. Conversely the farther
away a point is, the darker it is colored. There are currently two
depth map generation algorithms: Spatially Aggregating Depth Map Generator Pyramid-based Color Segmentation Depth Map Generator Here is an example of an image before and after the PyrSegmentation
algorithm was applied to it:
The algorithm then follows the same principle as in the Spatially Aggregating
DMG for choosing a depth map color. The only difference is that instead of considering a
fixed size, which is a function of the initial search window, it attempts to utilize every pixel within
a points color-segmented region. http://sourceforge.net/projects/opencvlibrary/ The Open Computer Vision Library is a collection of algorithms and sample code for various computer vision
problems, developed by Intel. OpenCV functions used in this project: The OpenCV library is written entirely in C, so in order
to integrate it into Java code, we used the Java Native Interface. http://java.sun.com/j2se/1.4.2/docs/guide/jni/index.html The Java Native Interface is a programming interface that
allows Java code to call and by called by native applications written in other
languages. This involves the creation of method wrappers in C++ that map Java types to
native types and vice versa, and perform memory management for the native
side. http://java.sun.com/products/javawebstart/ Java Web Start is a framework that allows full-featured
Java applications to be started directly from a web browser. We used Java
Web Start to run the PICS application from the internet, allowing users to
easily access the application, and to load images from a local file or a URL.
This allows users to experiment with determining depth from motion using their
own images. http://java.sun.com/products/java-media/jai/ Java Advanced Imaging is a Java platform extension API which provides a set of object-oriented interfaces that support a simple, high-level programming model which
\lets you manipulate images easily. http://jakarta.apache.org/commons/math/ Jakarta Mathematics Library is a library of
mathematics and statistics components addressing the most common problems not
available in Java. This package was used extensively in calculating averages and
standard deviations, as well as in linear regression fitting of depth patterns.
Step 1: Switch the source of images from "Local Images" to "Web Images," using the Combo box at the top.
Note that this will also automatically choose the first set of web images, and will automatically download them. The GUI
may pause for a moment while downloading the two input images.
Also maximize the "Point Correspondences" Window by clicking on the Middle icon in the top-right of the frame.
Step 2: Set the Point Matching Parameters and launch Point Correspondence Calculator:
For the initially loaded pair, the parameters displayed in the screen below work well:
1. Set "Template Width" and "Template Height" to 3.
2. Set "Depth Point Spacing" to 4.
3. Set "Minimum Point Laplacian" to 50.
After making the above changes, click the "Match Points" button at the bottom of the screen. The program will pause for a while, as it calculates
point correspondences in the background. Once it has finished, the points will automatically display in both images.
Change the value of any one of the three settings: "Maximum Correlation Difference SSD", "Maximum Reciprocal Distance", or "Minimum Template STD."
It is best to initially set the "Maximum Correlation SSD" and the "Maximum Reciprocal Distance" both to their max values (255 and 10),
while setting "Minimum Template STD" to the lowest value (0). Doing this prevents virtually any point matches from being filtered out.
GUI Details
To load images, first choose the location of the images using the dropdown lists at the top of the page.
Images should have a horizontal disparity, and the camera offset between the
left and right images should be in the right direction (after taking the left
image, the camera is moved to the right to take the right image). Images can be loaded from
local files or from a set of preloaded online images.
Next, use the dropdown lists in the two leftmost image windows to select which two images to use. If the right image does not fit on the screen, it will not immediately appear. To see the right image, first minimize the
Point Correspondence window, and then resize the window so that it is wide enough to accommodate the right image. The right image will then
appear.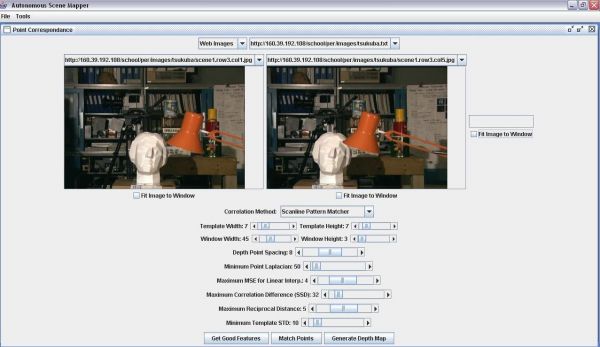
Default values: width = 7,
height = 7.
Default values: width = 45,
height = 3.
Default value: 8.
Default value: 50.
Default Value:
Default Value: 32.
Default Value: 5.
Default Value: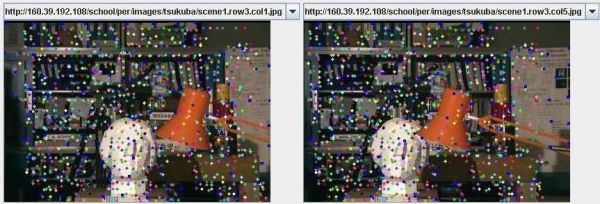
Disparity - distance between given point in left image and matched point in
right image.
Correlation - correlation between two matched points is measured in terms of the sum of squared differences between each pixel in the template in
the left image and the corresponding pixel in the matched template in the right
image.
Template Mean - the mean of the illumination in the left image point
template.
Template STD - the standard deviation of the illumination in the left image
point template.
Reciprocal Distance - to find the reciprocal distance of a point in the left image, the point is matched in the right image, and that corresponding point is again matched in the left image. The pixel distance between the original left image point and the matched left image point is the reciprocal distance of the original point.
There are currently two depth map generation algorithms: Spatially Aggregating Depth Map Generation and
Pyramid-based Color Segmentation Depth Map Generation.
To generate a depth map using the Spatially Aggregating DMG, simply adjust the
Maximum Correlation Difference (SSD), Maximum Reciprocal Distance, or
Minimum Template STD parameters. A depth map corresponding to the scene
in the left image will appear to the right of the right image. If it does not appear, widen the
Point Correspondence window until it does.
To generate a depth map using the Pyramid-based Color Segmentation DMG, press the
Generate Depth Map button. The depth map will appear to the right of the right
image. If it does not appear, widen the Point Correspondence window until it does.
Implemented Algorithms
eigImage. Then it performs non-maxima
suppression (only local maxima in 3x3 neighborhood remain). The next step is
rejecting the corners with the minimal eigenvalue less than qualityLevelmax(eigImage(x,y)).
Finally, the function ensures that all the corners found are distanced enough
from one another by considering the corners (the most strongest corners are
considered first) and checking that the distance between the newly considered
feature and the features considered earlier is larger than minDistance.
So, the function removes the features than are too close to the stronger
features.
The spatiality aggregating depth map generator was the first depth map generator to be implemented. It relies on the fact that nearby pixels often have the same depth.
First the DMG needs to decide on a coloring scheme, which determines what color each depth should receive. Statistics on the calculated depths of points are used for this purpose. First the mean depth of all used points is calculated. Then the upper and lower bounds for depth generation are calculated as the mean +/- the standard deviation. All depths equal to or below the mean minus a standard
deviation are colored black, all depths equal to or above the mean plus a standard deviation are colored pure white, and all depths in between this range are colored some shade of gray proportional to the depth. This method provides an effective adaptive method for coloring a variety of scenes which might have vastly different raw depth ranges.
Next, the aggregation phase occurs. For every point, the region defined by plus or minus ½ the window size is scanned. Every point found within this window will then be checked to see if it meets all of the filter criteria specified in the GUI, namely its Standard
Deviation, Reciprocal Distance, and Correlation values. Every pixel meeting this criteria is added to a weighted average for the depth of the particular point currently being considered. The weight is inversely proportional to the Minimum Difference between the template for the located point and the region which it matched. Thus is done so that points which are better matches count more heavily than point with poorer matches.
If the region defined by ½ the window size contains at least one or more points, then at the end of scanning the region, the weighted averages are tallied and normalized, giving a single depth for the point. If no points meeting the filtering criteria were found, then the region is colored red, indicating that insufficient points exist for depth-calculation.
The pyramid based color segmentation DMG relies on OpenCVs PyrSegmentation
algorithm. Color-based Pyramid segmentation groups adjacent pixels into ever increasing regions if the
difference between their illuminations is below some threshold. After performing pyramid-based segmentation, a list of regions of similar color
is produced and used for generating the depth map. 

This has the advantage of allowing points far outside the search window but often of the same depth
to be included in the depth map calculation. Unfortunately, it also has the disadvantage of potentially lumping together points of very different depths simply because they
have the same color, following color segmentation of the image.
Integrated Technologies
http://en.wikipedia.org/wiki/Opencv
http://en.wikipedia.org/wiki/Java_Native_Interface
http://en.wikipedia.org/wiki/Java_webstart
Links